

© 2026 Orderflow with SG. All Rights Reserved. The Volume Rhythm Indicator, including its source code, implementation, documentation, and branding, is the intellectual property of Orderflow with SG. Unauthorized copying, redistribution, resale, reverse engineering, or misrepresenting the software as your own, including on social media or any public platform, is strictly prohibited.
The concepts of Dry Volume, Normal Volume, and Spike Volume are part of the educational Volume Rhythm Framework and can also be identified manually by observing volume data and market participation. This indicator simply automates the classification process, making it faster, more consistent, and easier to interpret during live market conditions.
The educational concepts behind the Volume Rhythm Framework have been shared openly and freely through Orderflow with SG. Traders who understand the framework are free to manually apply these observations or develop their own implementation based on the publicly available educational material. This indicator is intended for traders who prefer the convenience of an automated implementation rather than manually performing the classification themselves.
The Volume Rhythm Indicator is a professional volume analysis tool developed for the GoCharting platform. Instead of treating volume as just another histogram, it automatically classifies every candle into three distinct market participation phases:
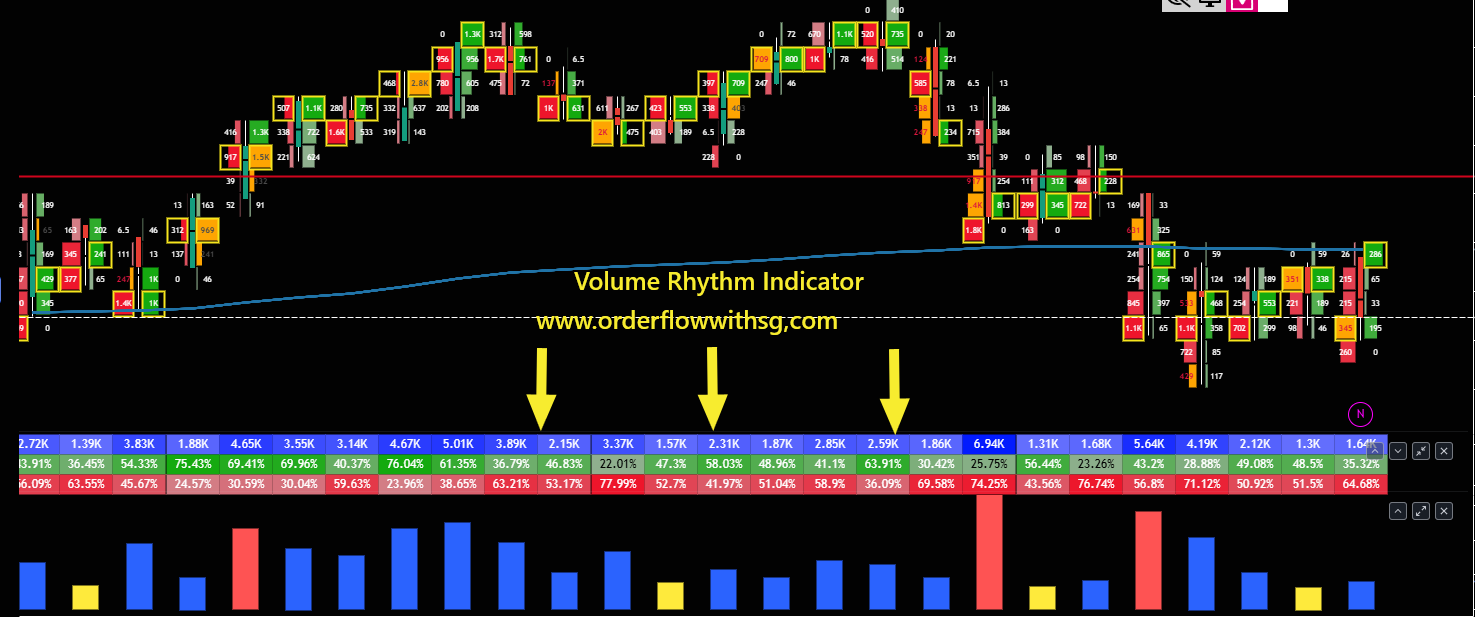
The indicator is built upon the Volume Rhythm Framework discussed on the Orderflow with SG YouTube channel and explained in detail at www.orderflowwithsg.com.
Its purpose is simple: Help traders understand how market participation changes from one candle to the next, allowing them to make more informed trading decisions instead of relying solely on price movement.
Many traders primarily notice volume during or after significant price moves.
The Volume Rhythm Indicator is designed to highlight shifts in market participation as they occur, making it easier to understand the auction taking place behind every candle.
Rather than manually comparing candle volumes throughout the trading session, the indicator automatically identifies the current participation phase, allowing traders to interpret Volume Rhythm quickly and consistently during live markets.
The indicator does not generate trading signals. Instead, it provides a structured way to recognize changing market participation so traders can combine the Volume Rhythm framework with their own market analysis and decision-making process.
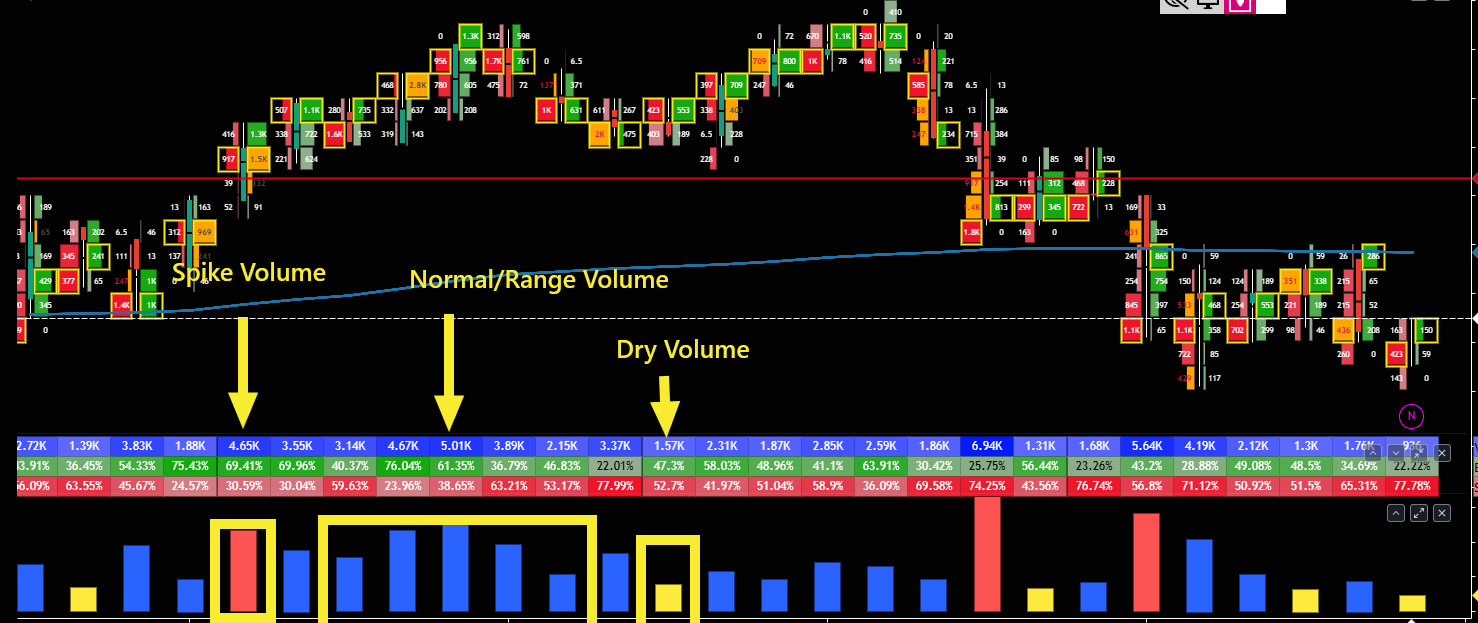 🔴 Spike Volume – Spike Volume identifies candles with exceptionally high market participation.
These candles are commonly observed during:
Spike Volume indicates unusually high participation and often accompanies periods of increased market activity.
However, Spike Volume is not a buy or sell signal by itself and should always be interpreted alongside price action, market structure, and other supporting analysis.
🔵 Normal/Range Volume – Normal Volume represents healthy and sustainable participation. These candles frequently form the foundation of balanced auctions, trends, and normal market activity where participation remains consistent.
🟡 Dry Volume – Dry Volume is one of the defining features of the Volume Rhythm Framework.
It represents periods where market participation has reduced significantly.
Depending on market context, Dry Volume may precede renewed participation, continue as consolidation, or simply reflect temporary inactivity.
Within the Volume Rhythm framework, Dry Volume zones are often observed as areas where traders may begin planning trades rather than chasing expanding candles.
The objective is not to predict the next move. The objective is to identify areas of reduced participation where a trader can prepare before participation expands, rather than reacting after the expansion has already begun.
This does not mean every Dry Volume candle will lead to a significant move. Instead, it helps traders focus their attention on areas where market participation may transition, allowing them to prepare rather than react.
The Volume Rhythm Indicator is designed to improve timing and market context, not predict future price movement.
It helps traders answer questions such as:
By understanding the rhythm of market participation, traders can avoid chasing extended moves and instead focus on opportunities where the risk-to-reward profile may be more favorable.
The indicator is intentionally simple to read during live trading.
With a quick glance, traders can immediately identify the current participation phase of every candle.
The Volume Rhythm Framework is discussed in detail through the official educational resources provided by Orderflow with SG.
📺 YouTube: Orderflow with SG
🌐 Website: www.orderflowwithsg.com
These resources explain the research, concepts, and practical application of the framework in greater depth. The indicator automates the identification of Volume Rhythm participation phases to assist traders in applying the framework more efficiently during live market analysis.