


Disclaimer
This analysis is based on personal trading experience, practical orderflow observation, and independent research. The views expressed are for educational purposes only and reflect the author’s understanding of market behavior. Copying or reproducing this paper, in whole or in part, is strictly prohibited
The Orderflow Lens — How I Read the Market
Most traders in India focus only on price charts.
Some add indicators.
Very few study orderflow — the real activity happening inside each candle.
My trading approach is built on one simple principle:
Price is the result. Orders are the cause.
I don’t predict.
I observe participation.
1️⃣ What I Actually Read on the Chart
The footprint chart is my primary tool.
Instead of focusing only on green and red candles, I study:
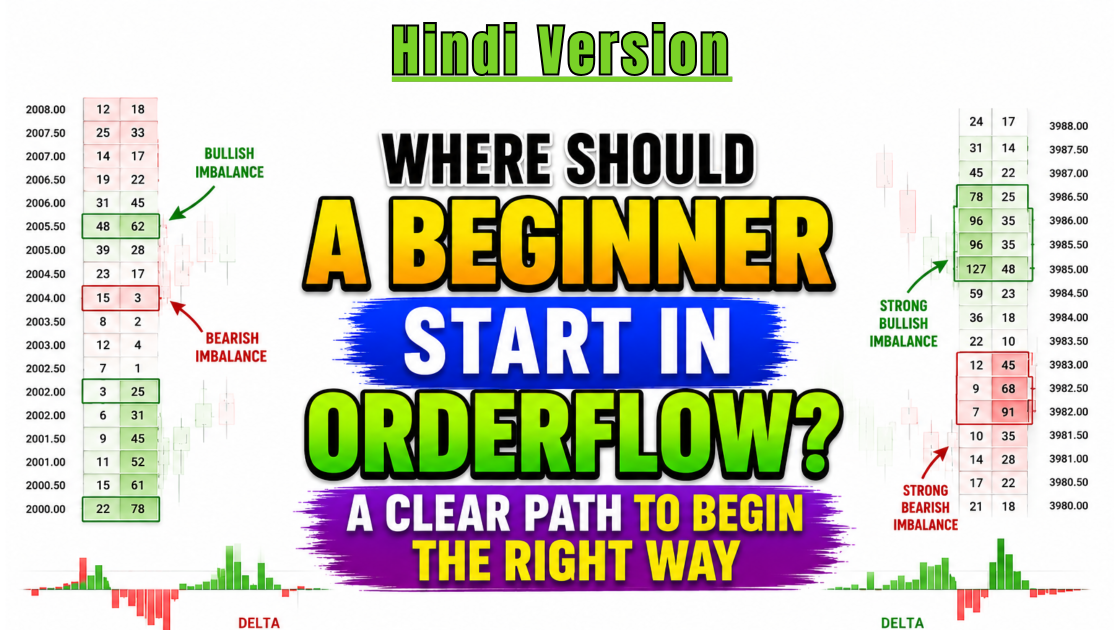
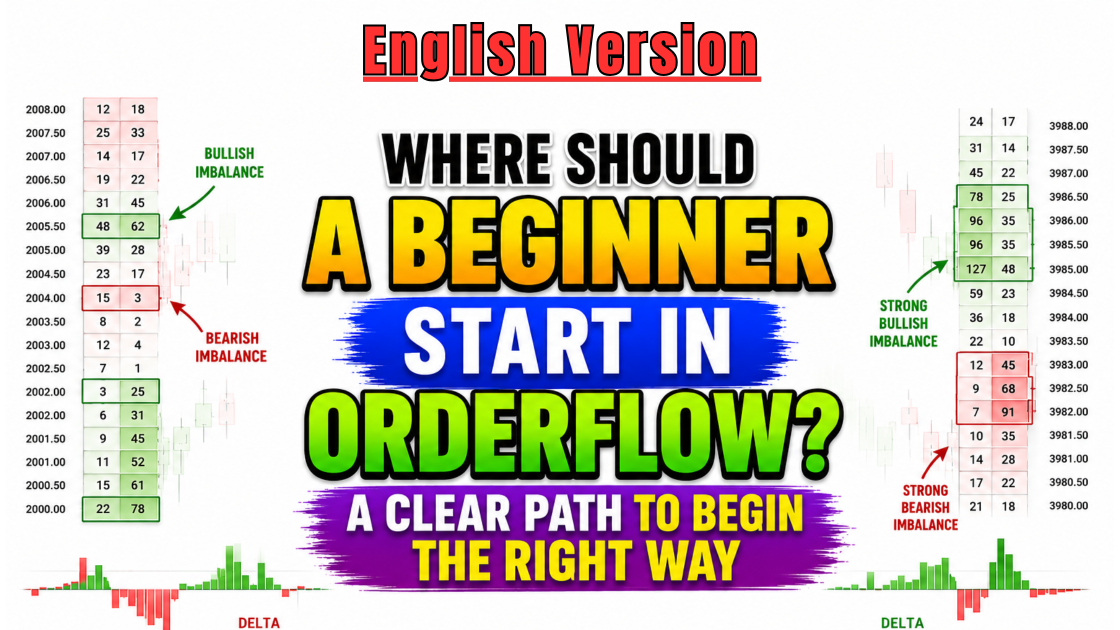
- Bid vs Ask aggression
- Volume imbalances
- Volume percentage dominance
- Absorption at key levels
- Acceptance or rejection near structure
This helps me understand whether buyers or sellers are genuinely in control —
or just temporarily active.
2️⃣ Volume Percentage — Who Is Really in Control?
One of the most important elements in my analysis is volume percentage dominance.
For example:
- If buyers control 65–70%+ of total traded volume, it often reflects strong initiative buying — especially when supported by continuation.
- If sellers dominate majority participation, it shows strong downside pressure.
- If volume is evenly distributed, it usually signals balance and rotational activity.
This distinction helps separate real strength from weak momentum.
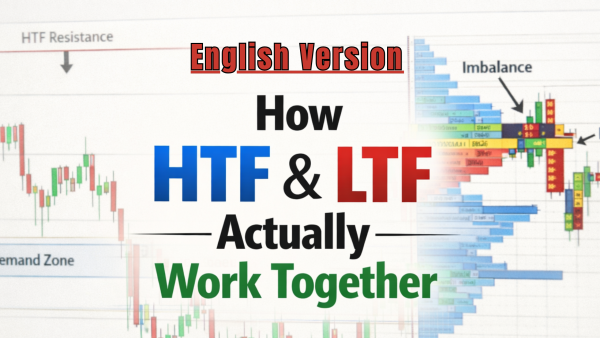
3️⃣ Auction Zero on 15m & 30m — Structured Auction Areas
On higher intraday timeframes like 15-minute and 30-minute charts, I pay special attention to what I call Auction Zero zones.
These are areas where:
- Heavy two-sided trade occurs
- Large volume builds without aggressive price displacement
- Price rotates rather than trends
Such zones represent meaningful auction activity.
Benefits of Using Auction Zero (15m & 30m):
- They frequently act as reaction zones when revisited
- They provide structural clarity around potential support or resistance
- They help filter weak breakouts
- They improve entry precision when combined with footprint confirmation
- They offer clearer risk-to-reward definition
When price revisits a 15m or 30m Auction Zero area, I don’t assume it will hold.
I observe:
- Is volume percentage shifting?
- Is absorption visible?
- Is participation expanding or contracting?
That alignment provides actionable clarity.
4️⃣ Structure + Participation Alignment
I never take trades based on a single candle.
Before entering, I evaluate:
- Are we trading near an important level?
- Is one side clearly dominating volume percentage?
- Is the move being accepted (continuation) or absorbed?
- Is participation expanding along with price?
If price moves but participation doesn’t expand, the move lacks conviction.
When structure and participation align, probability improves.
5️⃣ No Indicators. No Narratives. Just Evidence.
I don’t rely on lagging indicators.
I don’t trade market stories.
Large participants don’t announce themselves —
they execute orders.
When they become active:
- Volume expands
- One side dominates participation
- Price either continues with strength or stalls at absorption
That behavior is visible — if you know how to read it.
Final Thought
The market is an auction.
Price shows direction.
Volume shows participation.
Percentage dominance shows control.
When you start reading participation correctly,
you stop reacting emotionally —
and start trading with structure and logic.
Simple and clear process of trading with orderlow