


Disclaimer
This analysis is based on personal trading experience, practical orderflow observation, and independent research. The views expressed are for educational purposes only and reflect the author’s understanding of market behavior. Copying or reproducing this paper, in whole or in part, is strictly prohibited
Order-Flow Participation Using POC — How to Read High-Volume Nodes
Most traders read candle color.
Some read indicators.
Very few read participation inside the candle.
A candle is not just open, high, low, close.
It is a record of executed transactions — where aggressive orders met passive liquidity and meaningful interaction occurred.
That interaction leaves clues.
One of the clearest clues is the High-Volume Node (POC) inside a candle.
Before Using This Concept
Let’s clarify something important:
- This is not an entry signal
- Prefer using it on 5M / 15M timeframes
- It reflects participation — not guaranteed direction
- Always interpret within higher-timeframe context
- Most meaningful near prior high-interest areas
- Risk management is mandatory
This is a reading framework, not a mechanical setup.
Context always comes first.
What Is POC Inside a Candle?
POC stands for Point of Control.
Inside a single candle, it marks the price level where maximum traded volume occurred.
In simple terms:
It shows where the most business was done inside that candle.
But that volume does not “belong” to buyers or sellers individually.
Every executed trade requires:
- An aggressive participant (market order)
- A passive participant (limit order providing liquidity)
So the volume forming at a POC represents interaction between both sides.
What we interpret is not ownership of volume —
but who initiated the move and whether that effort produced result or got absorbed.
Important Definitions
Initiative
Initiative refers to aggressive participation that pushes price away from a previously traded area.
Acceptance
Acceptance means price spending time and building volume beyond the effort level.
Without acceptance, effort alone is not enough.
The Foundation — Effort vs Result
Everything revolves around this principle:
- If effort is high but result is poor → Absorption
- If effort is high and result follows → Initiative dominance
Effort is measured by concentration of traded volume.
Result is evaluated by closing position, continuation, and acceptance beyond that level.
Markets tend to expand when initiative achieves acceptance.
Markets tend to rotate when initiative is absorbed.
POC location helps us evaluate this relationship.
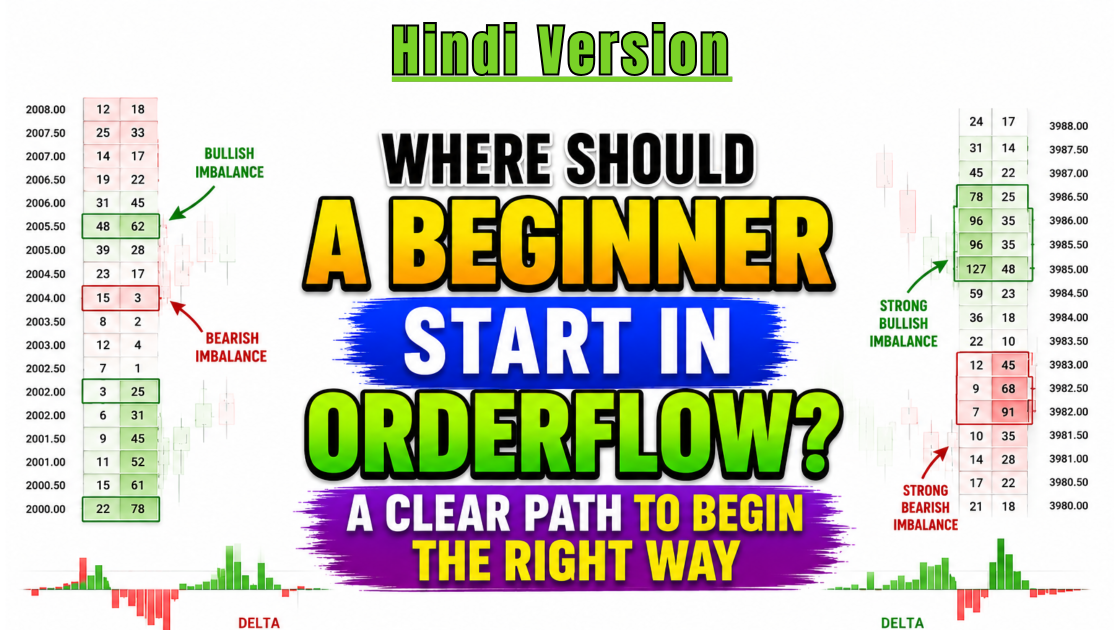
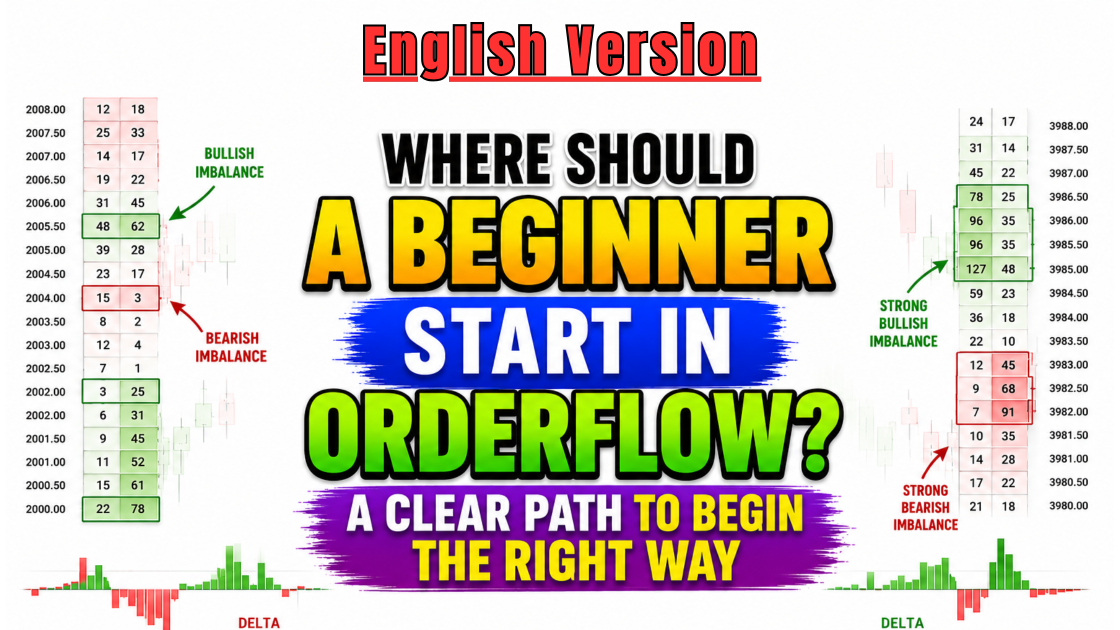
Understanding Left Side vs Right Side
In footprint representation:
- Left side volume typically reflects seller-initiated trades
- Right side volume typically reflects buyer-initiated trades
This distinction helps interpret where aggressive effort concentrated.
Potential Bearish Participation Structure
Two important observations:
1️⃣ Seller-Initiative POC Near Upper Wick (Left Side)
If sellers were most aggressive near the upper wick
and price ultimately closes below their maximum effort level,
It suggests seller initiative achieved result.
Higher prices were defended.
2️⃣ Buyer-Initiative POC Near Upper Wick (Right Side) With Poor Follow-Through
If buyers showed strong initiative near higher prices
but price failed to sustain above their effort level,
It suggests buyer absorption.
Their aggression did not translate into acceptance.
When Both Conditions Appear Together
- Sellers defend higher prices
- Buyers fail to gain acceptance
This reflects seller-side dominance and increases downside probability.
Probability — not certainty.
Potential Bullish Participation Structure
The opposite condition:
1️⃣ Buyer-Initiative POC Near Lower Wick (Right Side)
Buyers become aggressive at lower prices
and price closes above their effort level.
Effort → Result.
This suggests buyers successfully defended lower prices.
2️⃣ Seller-Initiative POC Near Lower Wick (Left Side) With Poor Follow-Through
Sellers attempted to push lower
but price failed to sustain below their effort level.
This suggests seller absorption.
When Both Conditions Appear Together
- Buyers defend lower prices
- Sellers fail to gain acceptance
This reflects buyer-side control and increases upside probability.
Variations — Why Context Matters
Not every candle presents a clean bullish or bearish structure.
You may observe:
- Buyer and seller POCs forming near the candle body
- Initiative visible on both sides
- Aggressive participation at both extremes
These are mixed participation conditions.
In such cases:
- Higher-timeframe bias becomes critical
- Market structure must confirm
- Acceptance beyond key levels must be observed
Without context, these variations can mislead.
A Practical 3-Step Reading Process
To use this framework effectively:
Step 1: Identify Effort
Where did maximum volume form inside the candle?
Step 2: Evaluate Result
Did price close beyond that effort level?
Did it gain acceptance?
Step 3: Observe Follow-Through
Does the next candle confirm continuation or rotation?
This sequence prevents premature conclusions.
What This Is NOT
This is not:
- A guaranteed reversal signal
- A standalone trading system
- A replacement for structure
- A substitute for risk management
It is a participation analysis tool.
Common Mistakes Traders Make
- Reading POC in isolation
- Ignoring higher-timeframe bias
- Assuming every absorption leads to reversal
- Trading every high-volume node
- Ignoring follow-through confirmation
Discipline lies in selective application.
Where This Works Best
This framework becomes more meaningful:
- Near prior high-volume zones
- Around key reference levels
- At structural highs or lows
- In alignment with higher-timeframe bias
Random application in low-interest areas reduces its value significantly.
What High-Volume Nodes Really Show
High-volume nodes inside a candle reveal:
- Where aggressive effort concentrated
- Where passive liquidity absorbed pressure
- Where meaningful interaction intensified
They do not predict the future.
They reveal participation quality.
And participation quality often precedes directional clarity.
Final Thought
A candle’s color tells you what happened.
A POC’s location tells you how it happened.
When you begin observing:
- Where effort concentrated
- Whether effort achieved acceptance
- Where absorption occurred
You stop reacting to price.
You start understanding participation.
And markets move because of participation —
not because of candle color.
-
-
-
-
-
-
-
Show CommentsThe article provides a clear and practical overview of Order Flow and the role of the Point of Control (POC) in market analysis highlighting its importance as a key area of liquidity. Showing how shifts in POC can signal changes in market sentiment and institutional positioning. The use of of connecting volume concentration with price behavior makes the concept accessible even to traders newer to order flow analysis. Overall, it’s a solid introduction that balances theory with actionable insight, particularly for futures and intraday traders looking to refine their entries and exits.
Thank you sir, orderflow chart reading is made simple, insanely clear to mind all the concepts poc, imbalance..,delta , key terms with live examples, we viewers are most lucky because I have seen trader Dale ,Mike Valtos , but ek dhum saatik, saral bhasha may sir ne sikaathe hai , hum logo ko iska fayada utana aur market analysis jaroor dekana. The olly Best trading cannel on OF . Sir include Volume profile as combos and teach us . We will follow practice earn and earn.Thank you so much for all your efforts .
very nice and informative artical ,explained about a candle inside orderflow and point of control insights … Thank you sir for this gold knowldge
Simple and clear
Super 👌
A comprehensive step by step analysis of trading using orderflow in simple practical terms. This is a real eye opener for day traders like me. Your grasp of this tool is amazing. Thank you for everything sirji.
Very useful and In depth analysis! Highly informative and easy to understand.