








Disclaimer
This analysis is based on personal trading experience, practical orderflow observation, and independent research. The views expressed are for educational purposes only and reflect the author’s understanding of market behavior. Copying or reproducing this paper, in whole or in part, is strictly prohibited
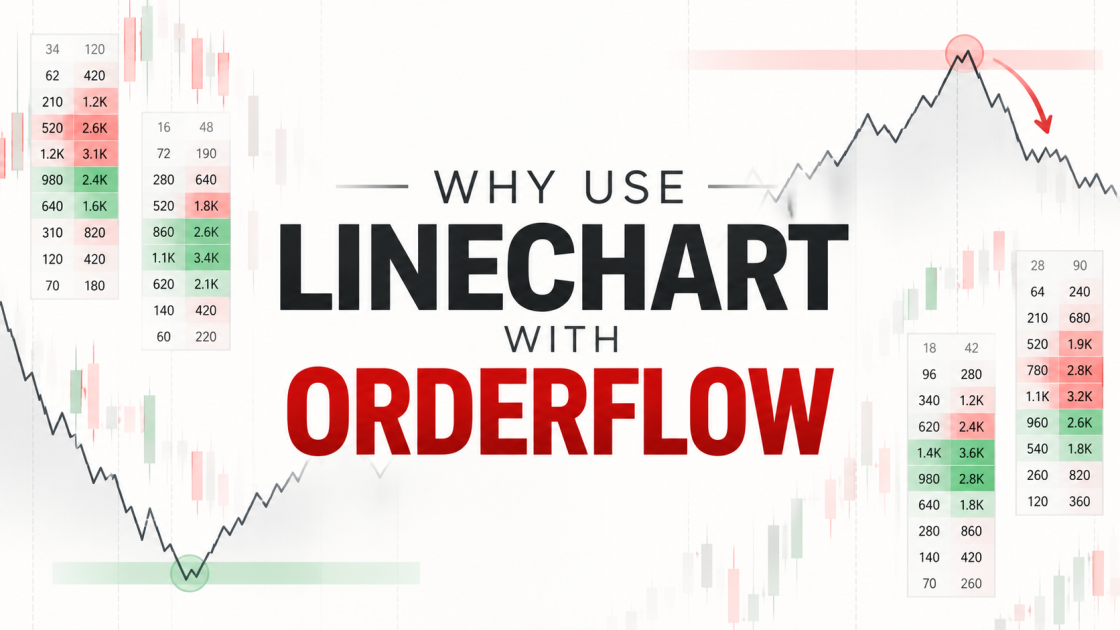
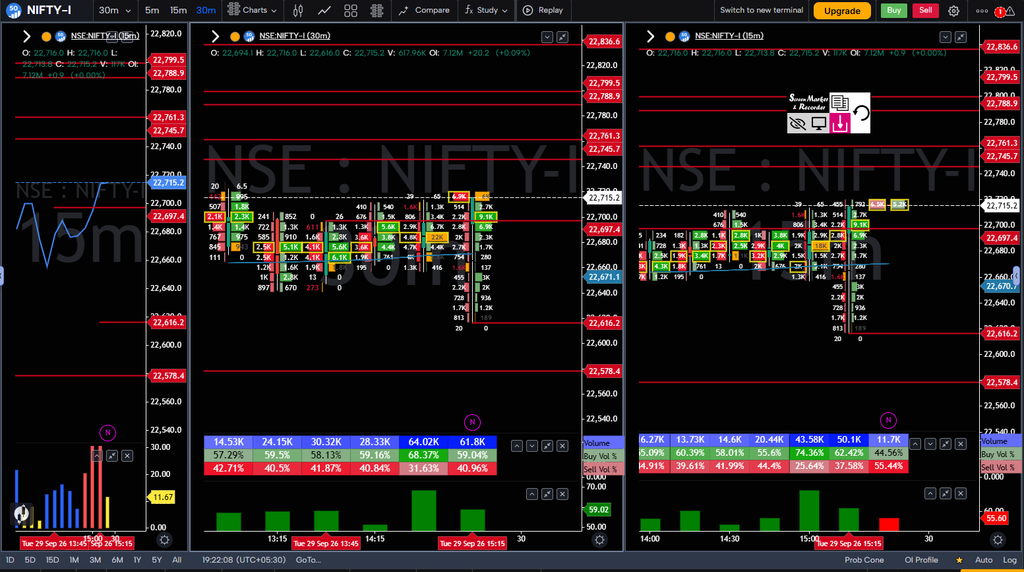
Using a Line Chart with Order Flow: Reading Structure, Behaviour and Reversals
One of the problems with footprint charts is that the more information they give you, the easier it becomes to lose sight of the simplest question: what is price actually doing?
Volume, POC, imbalances, buyer and seller participation and other order-flow information can tell us a great deal about what is happening inside the auction. But when the footprint becomes crowded with numbers, it is easy to focus so much on individual events that the larger price structure gets lost.
This is where I find a simple line chart surprisingly useful.
At first, using a line chart alongside a footprint may seem unnecessary. A footprint already contains price, so why remove the candles and look at a simpler representation of the same market? The reason is that I am not using the line chart to replace order flow, nor am I using it as another indicator to generate buy or sell signals. I use it for a much simpler purpose: to make the underlying price structure easier to see.
The two charts are not competing with each other. They are answering different questions.
The line chart shows the resulting price structure. The footprint shows the participation and behaviour taking place inside that structure.
Once those roles are separated, the combination becomes much more useful.
Why Does the Line Chart Often Appear to Reverse Too Late?
One of the first questions you may have is probably the same one I had when I started looking at this more closely:
If I wait for the line chart to turn, haven’t I already missed the reversal?
In many situations, the answer is yes. But that does not mean the line chart is bad at showing market structure. It means we are asking it to provide information that it was never designed to provide.
In its default configuration, a line chart connects the closing prices of each bar. This gives us a very clean representation of how price is progressing from one period to the next, but it also means that much of the movement that occurred inside each bar is removed.
Imagine price is moving higher. Buyers are becoming increasingly aggressive, volume is expanding and large buy imbalances are appearing near the highs. However, despite all this effort, price is struggling to make meaningful additional progress.
The footprint can show that change in behaviour while the line chart can still look bullish because the closing prices have not yet changed enough to alter the structure.
That is why a line chart can appear to turn late.
The important point is that it is not necessarily supposed to identify the earliest possible reversal.
I find it much more useful to treat the line chart as a representation of market structure, while using order flow to examine whether the behaviour supporting that structure is continuing or beginning to deteriorate.
There is also a trade-off. The simplicity of the line chart comes from removing information. A closing-price line does not show the intrabar path that price took to reach that close. Two bars can have very different internal auctions and still produce very similar points on the line.
That is precisely why I would not use the line chart alone for order-flow analysis.
Its job is to simplify structure, not replace the information contained in the footprint.
The Line Chart Shows Structure, Order Flow Shows Behaviour
Consider a simple upward structure. Price is making a higher high, pulling back, forming a higher low and then making another higher high. On a line chart, this sequence is immediately visible without having to interpret every candle.
Now imagine that during the latest attempt to make a higher high, the footprint starts showing something different.
Buyers are becoming increasingly aggressive. Volume is increasing. Buy imbalances are appearing. Buyer participation is strong. Yet price is struggling to make meaningful progress beyond the previous high.
The line chart may still look completely bullish.
And that is perfectly fine.
The footprint is not necessarily contradicting the line chart. It is giving us additional information about the behaviour behind the price movement.
The structure is still bullish, but the quality of the current move may be changing.
This is where one of the most important concepts in order flow becomes useful:
Effort versus Result.
Strong Buying Does Not Automatically Mean a Strong Uptrend
A common mistake when reading footprints is to see strong buying and immediately conclude that buyers are in control.
Suppose we see 70% or 75% buyer participation together with several large buy imbalances. It is tempting to conclude that price should continue higher.
But aggressive buying tells us about effort. It does not, by itself, tell us whether that effort was effective.
The more important question is what happened to price as that buying occurred.
If strong buying produces strong upward movement, the aggression is producing a corresponding result. Buyers are putting in effort and price is responding.
But what happens when the footprint shows substantial buying and price barely moves?
Now the relationship between effort and result has changed.
The buyers may still be aggressive. They may still account for a large percentage of the traded volume. But that aggression is producing less price progress than we would expect from the amount of effort being displayed.
That is where I start paying attention.
I am not calling a reversal simply because buying has become less effective. Instead, I am recognising that the existing directional move may be losing effectiveness.
That distinction matters.
Ineffective aggression is evidence that the market’s response is changing. It is not, by itself, proof that a reversal must follow.
This Is Where Order Flow Can Reveal Change Before the Line Chart Does
Imagine that the line chart is still showing a clean sequence of higher highs and higher lows. Nothing has technically broken.
However, the latest high is being tested with increasingly strong buying, yet price cannot move significantly beyond it. A second attempt produces more participation but still little progress.
At this point, the line chart may still be pointing upward.
But the footprint is telling us that the behaviour inside that upward structure is changing.
This is where I would describe order flow as an early warning mechanism, rather than a reversal confirmation mechanism.
Order flow can reveal that the current move is becoming less effective before that change becomes obvious in closing-price structure.
That does not mean the footprint is predicting the future. It means that it is giving us information about the current auction that a close-based line chart does not display as directly.
This is also why I would be careful with terms such as “absorption.” Strong buying followed by limited price progress can be consistent with absorption or strong opposing liquidity, but the footprint itself does not directly show every resting order responsible for that response. The interpretation becomes stronger when we see repeated attempts, significant participation and a persistent lack of price progress.
So instead of saying:
“Buyers are being absorbed, therefore price will reverse.”
I prefer:
“Buyers are showing significant effort, but the resulting price response is weakening. I now want to see what happens next.”
That keeps the analysis grounded in what the data is actually showing.
A Reversal Is Better Understood as a Process
I find it more useful to think about a potential reversal as a process rather than a single footprint event.
The first stage is the existing directional structure. For example, price is making higher highs and higher lows, so the market is structurally bullish.
The second stage is a change in effectiveness. Buyers continue to participate, but their effort is producing less price progress. This is where effort versus result becomes important.
The third stage is a change in participation. The distribution of activity may begin shifting away from buyers and toward sellers. Repeated attempts to move higher may also fail to produce meaningful continuation.
None of this necessarily means that the market has reversed.
It means that the existing directional auction is no longer behaving as efficiently as before.
The final stage is a structural shift. If the market subsequently breaks the higher low that had been supporting the uptrend, the bullish structure is no longer intact.
That is where I find the two charts complement each other particularly well.
Order flow can show that behaviour is changing. Price structure shows whether that change has actually altered the market’s structure.
So Should We Wait for the Line Chart to Turn?
Not necessarily.
There is a difference between becoming interested in a potential reversal and confirming that the previous structure has changed.
If I wait until the line chart has already developed several lower closes before I even start examining the order flow, then naturally my analysis will be later. By that point, the market may already have moved considerably.
Instead, I want the line chart to establish the structural context first.
If the structure is bullish, I want to know whether the buying is still effective. If the structure is bearish, I want to know whether the selling is still effective.
Once the footprint starts showing a deterioration in effectiveness, that is when my attention increases.
The line chart does not need to turn at that moment. It simply needs to tell me what structure I am currently dealing with.
The footprint then tells me whether the behaviour within that structure is continuing to support it.
This creates a useful distinction:
The line chart establishes the structure. Order flow helps us evaluate the condition of that structure.
What About Imbalances?
This is where it becomes important not to turn the entire process into another mechanical indicator.
A buy imbalance should not simply mean “buy,” just as a sell imbalance should not automatically mean “sell.”
The location of the imbalance matters. The surrounding participation matters. Most importantly, the result after the imbalance matters.
Suppose a strong buy imbalance appears near an important lower auction area and price responds strongly upward. That is very different from repeated buy imbalances appearing near an established high while price barely progresses.
Both situations contain aggressive buying, but the market is responding to that buying differently.
In the first case, aggressive buying is producing a meaningful price response.
In the second, aggressive buying may be struggling to produce the expected result.
That is why I prefer to ask:
Where did the imbalance occur, and what did price do afterward?
The imbalance itself is only one part of the story.
This is also why I do not treat imbalance as an independent signal. The useful information comes from combining the aggression with its location, participation and resulting price behaviour.
POC Adds Another Layer to the Same Analysis
The same principle applies to POC.
I do not look at POC simply as a line that tells me where to buy or sell. I am more interested in what the POC tells me about where significant participation was concentrated and how price behaves around that area.
Suppose price is moving upward, participation is expanding and the market begins spending time and building volume at higher prices. That is different from a situation where substantial volume repeatedly concentrates around one area while price struggles to move away from it.
This is where POC becomes particularly useful when combined with the line chart.
The line chart tells me where price is structurally.
The POC gives me a reference for where significant participation was concentrated.
The footprint tells me how participants are behaving around that participation.
And effort versus result helps me determine whether that behaviour is producing the expected price response.
Importantly, a POC shift by itself does not establish acceptance. I want to see how price behaves beyond the relevant area and whether participation continues to develop there.
None of these needs to work as an independent signal.
Together, they give us a much clearer picture of the auction.
The Same Concept Works on the Short Side
The exact same framework can be applied to a downtrend.
Suppose the line chart shows lower lows and lower highs. The structure is clearly bearish.
Now imagine sellers become increasingly aggressive near a new low. Volume increases and sell imbalances appear throughout the footprint, but price begins struggling to extend lower.
If selling effort continues to increase while downside progress decreases, the bearish move may be losing effectiveness.
Again, this does not automatically mean that buyers will take control.
It simply gives us a reason to watch closely.
If the distribution of participation subsequently shifts toward buyers, selling becomes less dominant, and price eventually breaks the previous lower high, the bearish structure is no longer intact.
The line chart then makes visible the structural change that the footprint had been helping us monitor.
The Framework I Prefer
This gives me a relatively simple way of combining the two.
I start with the line chart to understand structure and direction. Is price making higher highs and higher lows? Lower highs and lower lows? Or is the market simply moving sideways?
Then I use the higher-timeframe footprint to understand where significant participation and important auction areas exist. The lower-timeframe footprint becomes the place where I examine current behaviour: buyer and seller participation, imbalances, POC movement, volume expansion or contraction, and most importantly, effort versus result.
From there, I am looking for continuation or deterioration.
If the market is moving higher and buying continues to produce higher prices, there is little reason to assume that the existing bullish structure has changed.
If buying becomes increasingly aggressive but price stops responding proportionally, the market deserves closer attention.
If the distribution of participation subsequently begins shifting toward sellers and the lack of continuation persists, the evidence of changing behaviour becomes stronger.
And if the relevant structural low eventually breaks, we now have evidence that the previous bullish structure is no longer intact.
That is a much more useful role for the line chart than simply waiting for it to “turn.”
Why I Like This Combination
The biggest advantage is that the two charts answer different questions.
The line chart answers:
What is the market structure right now?
The footprint asks:
What is happening inside that structure?
And effort versus result asks:
Is what is happening actually working?
This also helps prevent one of the biggest problems with order-flow analysis: becoming so focused on individual numbers that the larger market structure disappears.
A footprint can contain hundreds of pieces of information. A line chart can reduce all of that to a simple sequence of price movement.
That simplicity is valuable.
It gives you somewhere to step back to when the footprint becomes noisy.
At the same time, the simplicity comes with a cost: the line chart removes information about the intrabar path. That is exactly why I would never use it as a replacement for the footprint.
The two are useful precisely because one simplifies the picture while the other gives us the detail.
The Important Distinction: Warning vs Structural Change
This is perhaps the most important idea I would take away from this entire approach.
Order flow does not have to show a structural change at the same moment that price structure shows one.
They are observing different aspects of the auction.
Order flow can provide an earlier indication that the current move is losing effectiveness. Price structure may only change later.
That does not make the order flow “early” and the line chart “bad.”
They are simply measuring different things.
Order flow helps us understand the auction behaviour.
The line chart makes the resulting price structure easier to see.
Therefore, instead of asking which one is better at finding reversals, I prefer to ask how they can be used together.
That leads to a much cleaner process:
Structure → Behaviour → Effectiveness → Participation Shift → Structural Change
The important word here is change.
A deterioration in order flow does not guarantee a reversal. A structural break does not guarantee that price will continue all the way in the opposite direction. What it does is give us progressively stronger information about whether the previous directional structure is still intact.
That is how I prefer to look at direction and reversals using Orderflow Concepts by SG.
Final Thoughts
A line chart can look deceptively simple, especially when compared with a footprint full of numbers, imbalances and volume information. But that simplicity is exactly what makes it useful.
I don’t use the line chart because I expect it to predict the next reversal.
I use it because it makes the structure visible.
Then I use order flow to understand whether the behaviour inside that structure is supporting the current direction or beginning to deteriorate.
If buyers are pushing price higher and their effort continues to produce a meaningful result, the structure has a reason to remain intact.
If buyers continue increasing their effort but price stops responding proportionally, I become interested in what is changing.
If participation subsequently shifts and the market begins showing evidence of changing behaviour, I watch the relevant structural level.
And if that structure eventually breaks, the line chart makes the change visible.
That is the real value of combining the two.
The line chart tells me where the market is structurally. Order flow tells me what participants are doing there. Effort versus result tells me whether their actions are effective. And price structure tells me whether the previous structure has actually changed.
The goal is therefore not to make the line chart predict reversals earlier.
The goal is to stop expecting one chart to do everything.
When each chart has a specific job, the analysis becomes considerably cleaner:
Line Chart → Structure
Footprint → Behaviour
Effort vs Result → Effectiveness
Participation Shift → Developing Change
Structure Break → Confirmation of Structural Change
That is the combination I find far more useful than treating the line chart as another standalone reversal indicator.
This article reflects the author’s approach to reading market structure and order flow for educational purposes. Order-flow observations describe market behaviour; they do not guarantee a particular future price outcome
If you notice any discrepancy in this article or have questions regarding the concepts discussed, please contact the admin at sg@orderflowwithsg.com or connect with us through our Telegram channel.

-
-
-
-
-
-
-
Show CommentsYour knowledge and the way you explained everything are truly amazing.
Thank you for sharing such valuable insights—it was really helpful .
Impressive information sir.
It is really good and quite an effort. I really appreciate the way you apply Line chart along with Foot Print / Order Flow. Keep going and keep helping us to understand and analyse it better. Another important point covered imbalance; which doesn’t mean blindly favouring one side, like we were doing upto now, but realising its effect and accordingly plan an action, if required.
Thanks a lot for time, effort, analysis and teaching
Amazing concepts and great insights. Clarity and to the point analysis which makes trading easier and simpler. Thanks
thank you so much sirji
Very well written article. Thanks for the insights.
Very good concept ,thankyou sir