










BTCUSDT Order Flow Analysis
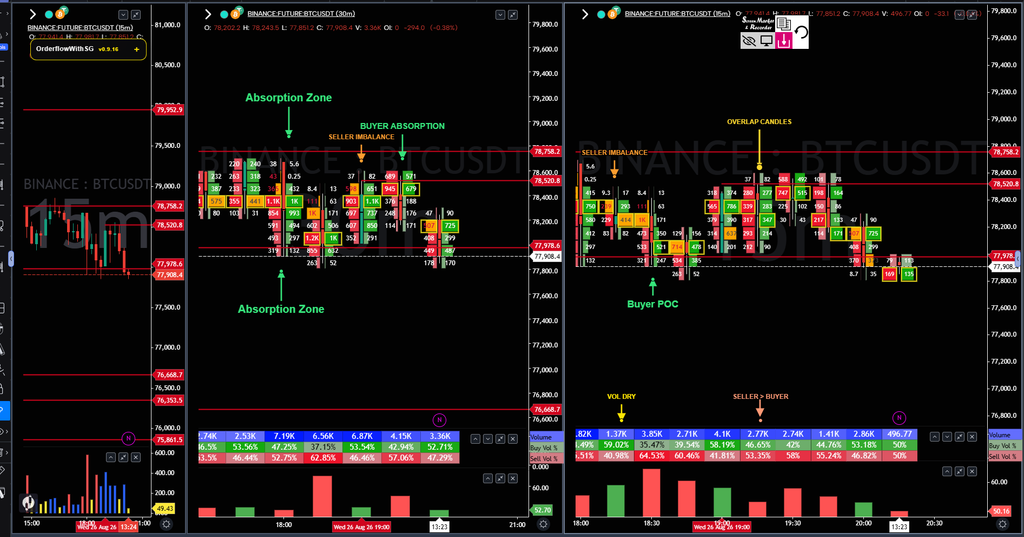
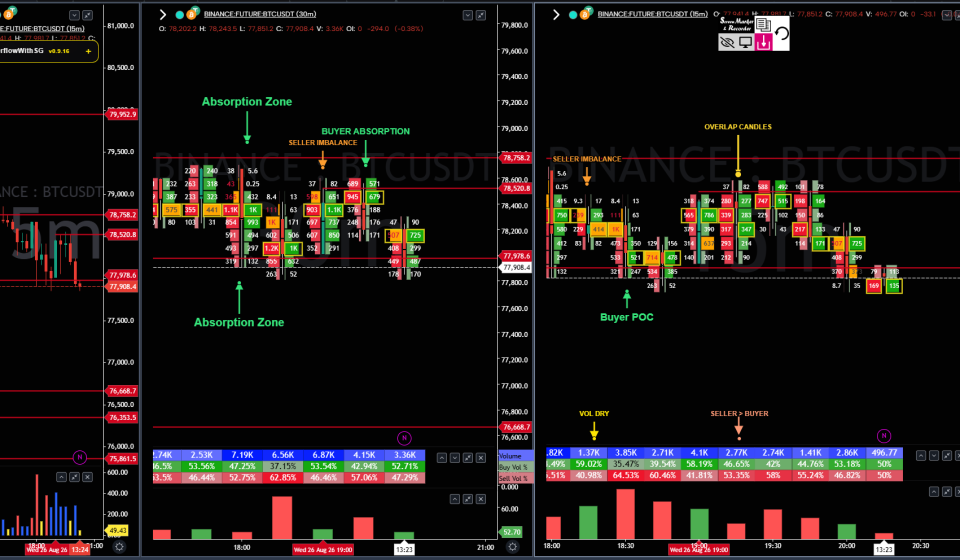
This BTCUSDT chart highlights a short-term battle between buyers and sellers around key liquidity and absorption zones. The footprint structure shows buyer absorption near the lower zone, seller imbalance near the upper zone, and weakening volume participation as price moves through the range.
🔴 What We Analyse
✔ Buyer Absorption: Strong buying activity is absorbed near the lower support area, indicating sellers are struggling to push price lower.
✔ Seller Imbalance: Multiple seller-dominant areas appear toward the upper portion of the range, showing active selling pressure as price moves higher.
✔ Buyer POC: The lower footprint area shows a significant concentration of traded volume, marking an important reference for buyer participation.
✔ Overlap Candles: Repeated price overlap near the upper zone suggests hesitation and two-sided auction activity rather than clean directional continuation.
✔ Volume Rhythm: The later candles show drying volume, indicating declining participation and weaker momentum.
✔ Seller > Buyer: The final structure shifts toward seller dominance, suggesting that buyers are losing control of the short-term auction.
📊 Order Flow + Footprint
The key takeaway is the interaction between absorption and imbalance. Buyers initially defend the lower area, but selling pressure develops as price approaches the upper resistance zone. With volume subsequently drying up and seller participation increasing, the chart suggests a market moving from active buying toward a more balanced-to-seller-controlled auction.
The important levels are therefore the buyer absorption/POC zone below and the seller imbalance zone above. A sustained move away from these areas, supported by expanding volume, would provide stronger confirmation of the next directional move.
This is a footprint-based reading of market participation, not a standalone trade signal.